Livestreams
 Experience real-time campus vibrations live on Twitch! If you cannot see the embedded video go to our Twitch Channel , scan the QR code or check out our list of planned livestreams.
Upcoming
| When | Type | What | Where | Stream start |
|---|---|---|---|---|
Passed
| When | Type | What | Where | Link |
|---|---|---|---|---|
| 22.09.2024 | Linkin Park | Barclays arena | summary | |
| 15.09.2024 | HSV - Regensburg | Volksparkstadion | post | |
| 04.09.2024 | Justin Timberlake | Barclays arena | ||
| 30.08.2024 | Deichkind | Trabrennbahn | post ; | |
| 31.08.2024 | HSV - Münster | Volksparkstadion | ||
| 13.09.2024 | Scorpions | Barclays arena | ||
| 23.08.2024 | Robbie Williams | Trabrennbahn | ||
| 22.08.2024 | Robbie Williams | Trabrennbahn | ||
| 10.08.2024 | HSV - Hertha | Volksparkstadion | post | |
| 23.07.2024 | Taylor Swift | Volksparkstadion | summary; posts | |
| 24.07.2024 | Taylor Swift | Volksparkstadion | summary; posts | |
| 05.07.2024 | EM24 Portgual-Frankreich | Volksparkstadion | summary |
What am I looking at??
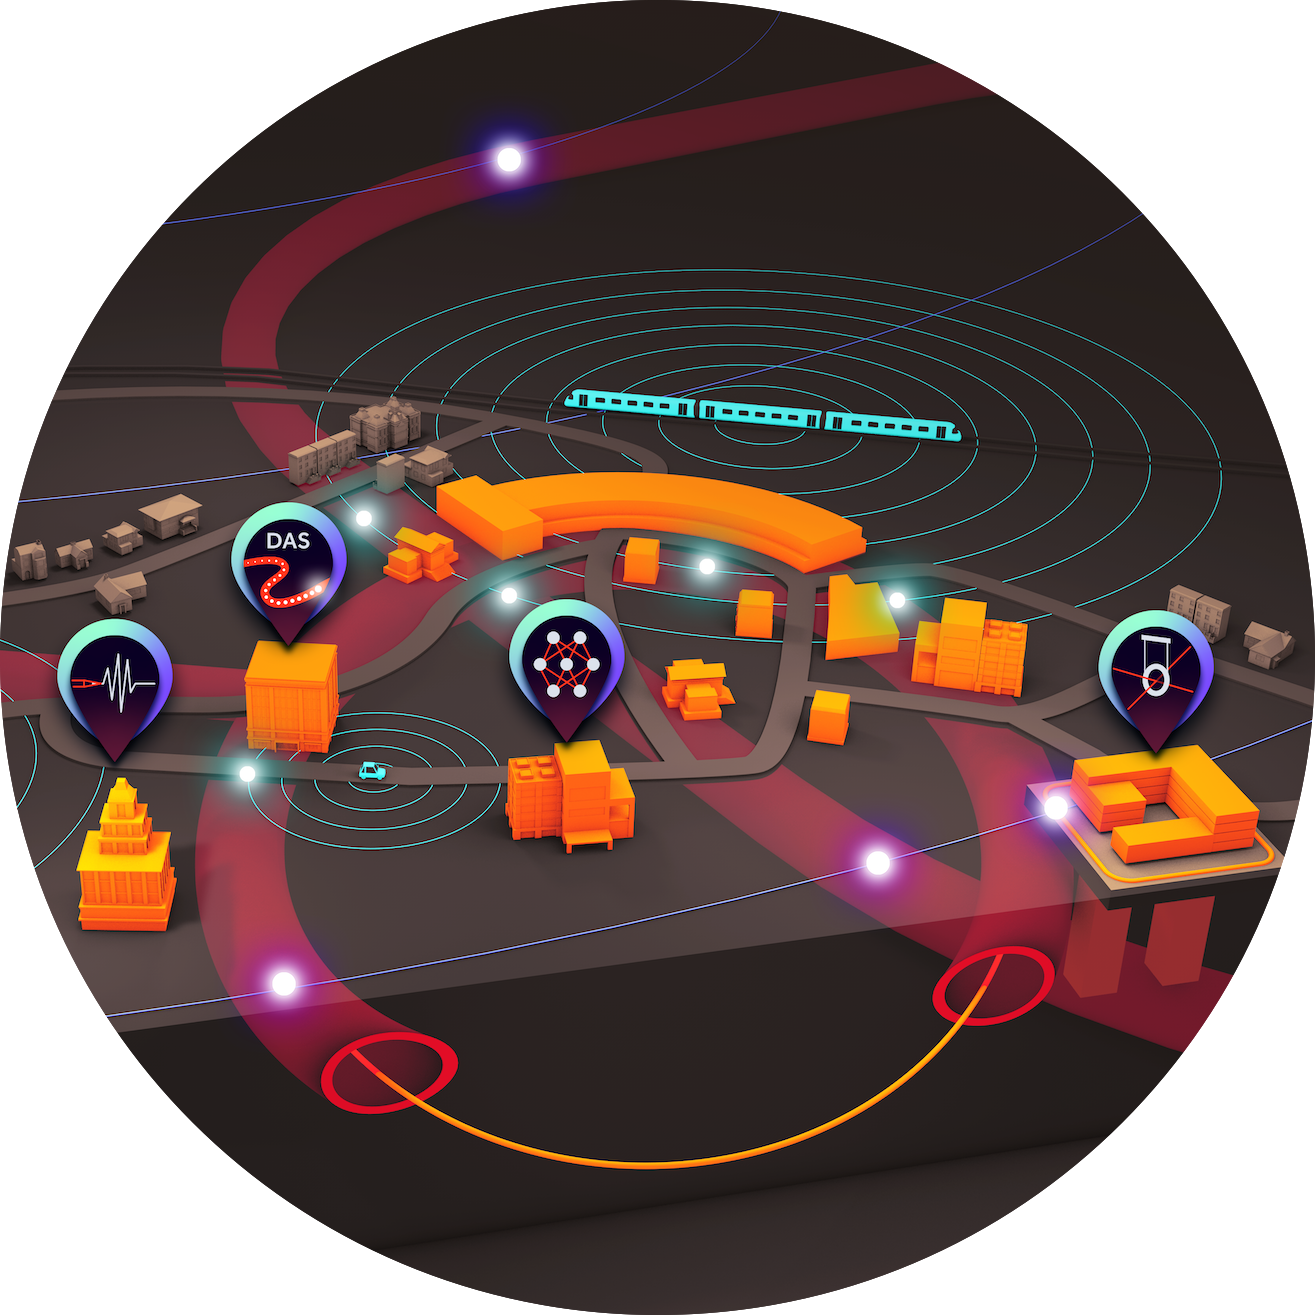
In the livestream, you can see the vibrations, or ‘wiggles,’ measured on the campus with the WAVE fiber network. The following map highlights the WAVE fiber in yellow, spanning 19 km across the campus. It measures campus vibrations every 10 meters whenever an event occurs. Three main locations are marked where events like soccer games or concerts take place. Even at a distance of 2 km, such as the Volksparkstadion, these events cause noticeable vibrations on the campus.

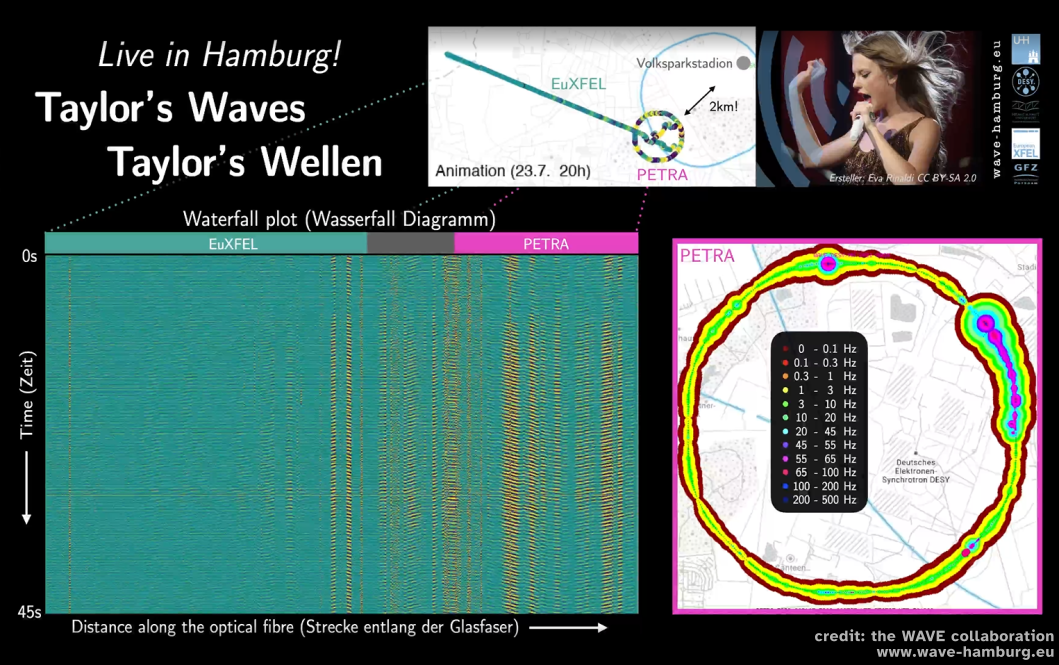
Over the past we improved the visualisations of the live seismic data stream. An overview of all livestream waterfall diagrams can be found here. Our latest real-time viewer of the waterfall diagram is integrated into our Twitch livestream. The following clip was recorded during a soccer game on August 10, 2024, and captures signals from the Volksparkstadion arriving on campus as drums and crowd stomping echoed through the stadium.
Each vertical line in the image indicates how much a specific section of the fiber is vibrating. Yellow represents strong vibrations, while green/blue indicates quieter areas.
Starting from the left, you can see the vibrations currently detected in DESY’s PETRA tunnel. Since the tunnel is a few meters underground, vibrations from car traffic, wind, and other surface activities are minimal, resulting in mostly green/blue areas. The same is true for the XFEL tunnel, which also appears ‘quiet’ and green/blue.
As you move further to the right in the waterfall diagram, the fiber approaches the surface and roads on the DESY/Bahrenfeld campus. Here, car traffic, swaying trees, and urban activity create more vibrations, causing these sections of the fiber to show yellow.
The entire image scrolls upward to represent the passage of time.
These are tiny vibrations! Although you wouldn’t feel them, our measurement device is extremely sensitive.
You’ve probably felt the ground shake when a big truck passes by. It’s the same effect, just much weaker, and results from numerous trucks, cars, swaying trees, and other surface activities happening simultaneously.

On the left, you can see a geoplot where the fiber track is georeferenced onto the campus map, showing vibrations at specific geopositions. Each bubble represents a different frequency window: slow vibrations on the campus are depicted at low frequencies, such as 4 Hz, while faster vibrations, like those from acoustics or pumps, are shown at higher frequencies. The size of each bubble indicates the signal strength.
Concerts
Taylor Swift
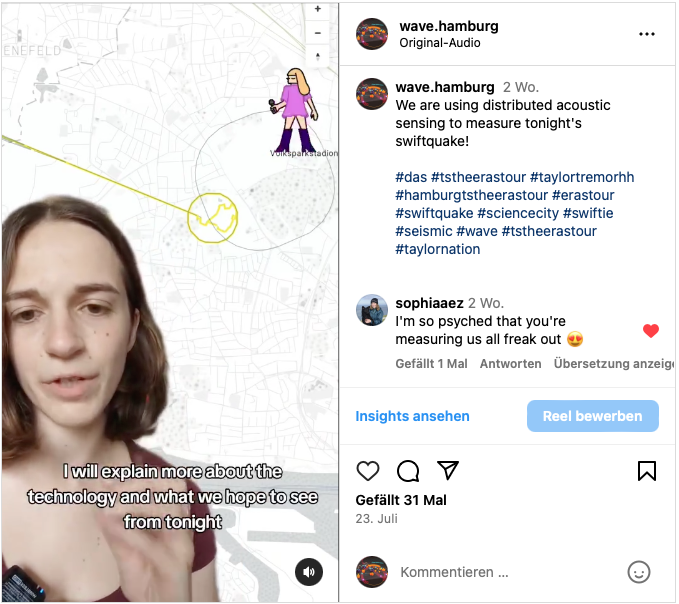
With our WAVE glass fiber sensor network, we listen to vibrations underground with a thousand ears. On July 23rd and 24th 2024, Taylor Swift performed at the Volksparkstadion Hamburg, just 2 km from our experiment!
During the two concerts, we offered a livestream of our vibration measurements. We broadcasted our measurements on the Livestream on 23th of July at 18:00 – 23:00 CEST and again on 24th of July at 18:00 – 23:00 CEST. Watch this space, we will update with more results over the next few days. “Swiftquakes?!” Don’t worry, these are not real earthquakes!
These are tiny vibrations! You would not feel them, our measurement device is really sensitive. You’ve probably felt the ground shaking a bit when a big truck passes nearby? It’s the same effect, just caused by lots of happy people dancing.
We already knew that we should able to pick up vibrations of concerts happening in the Volksparkstadion, since we have already picked concerts e.g. by Metallica in the past. Lots and lots of fans jumping and dancing at the same time will cause the ground to “swing along” a bit.

Spectrogram
From the waterfall plot, shown on the left in the Livestream, we calculated a spectrogram of the Taylor Swift concert, with some songs annotated.

The brighter yellow colors indicate stronger vibrations. The ‘ladder structures’ shift up and down with the beats per second of the song – this is probably a result of the fans jumping to the beat, and with that, they generate specific frequencies.
PETRA’s heartbeats
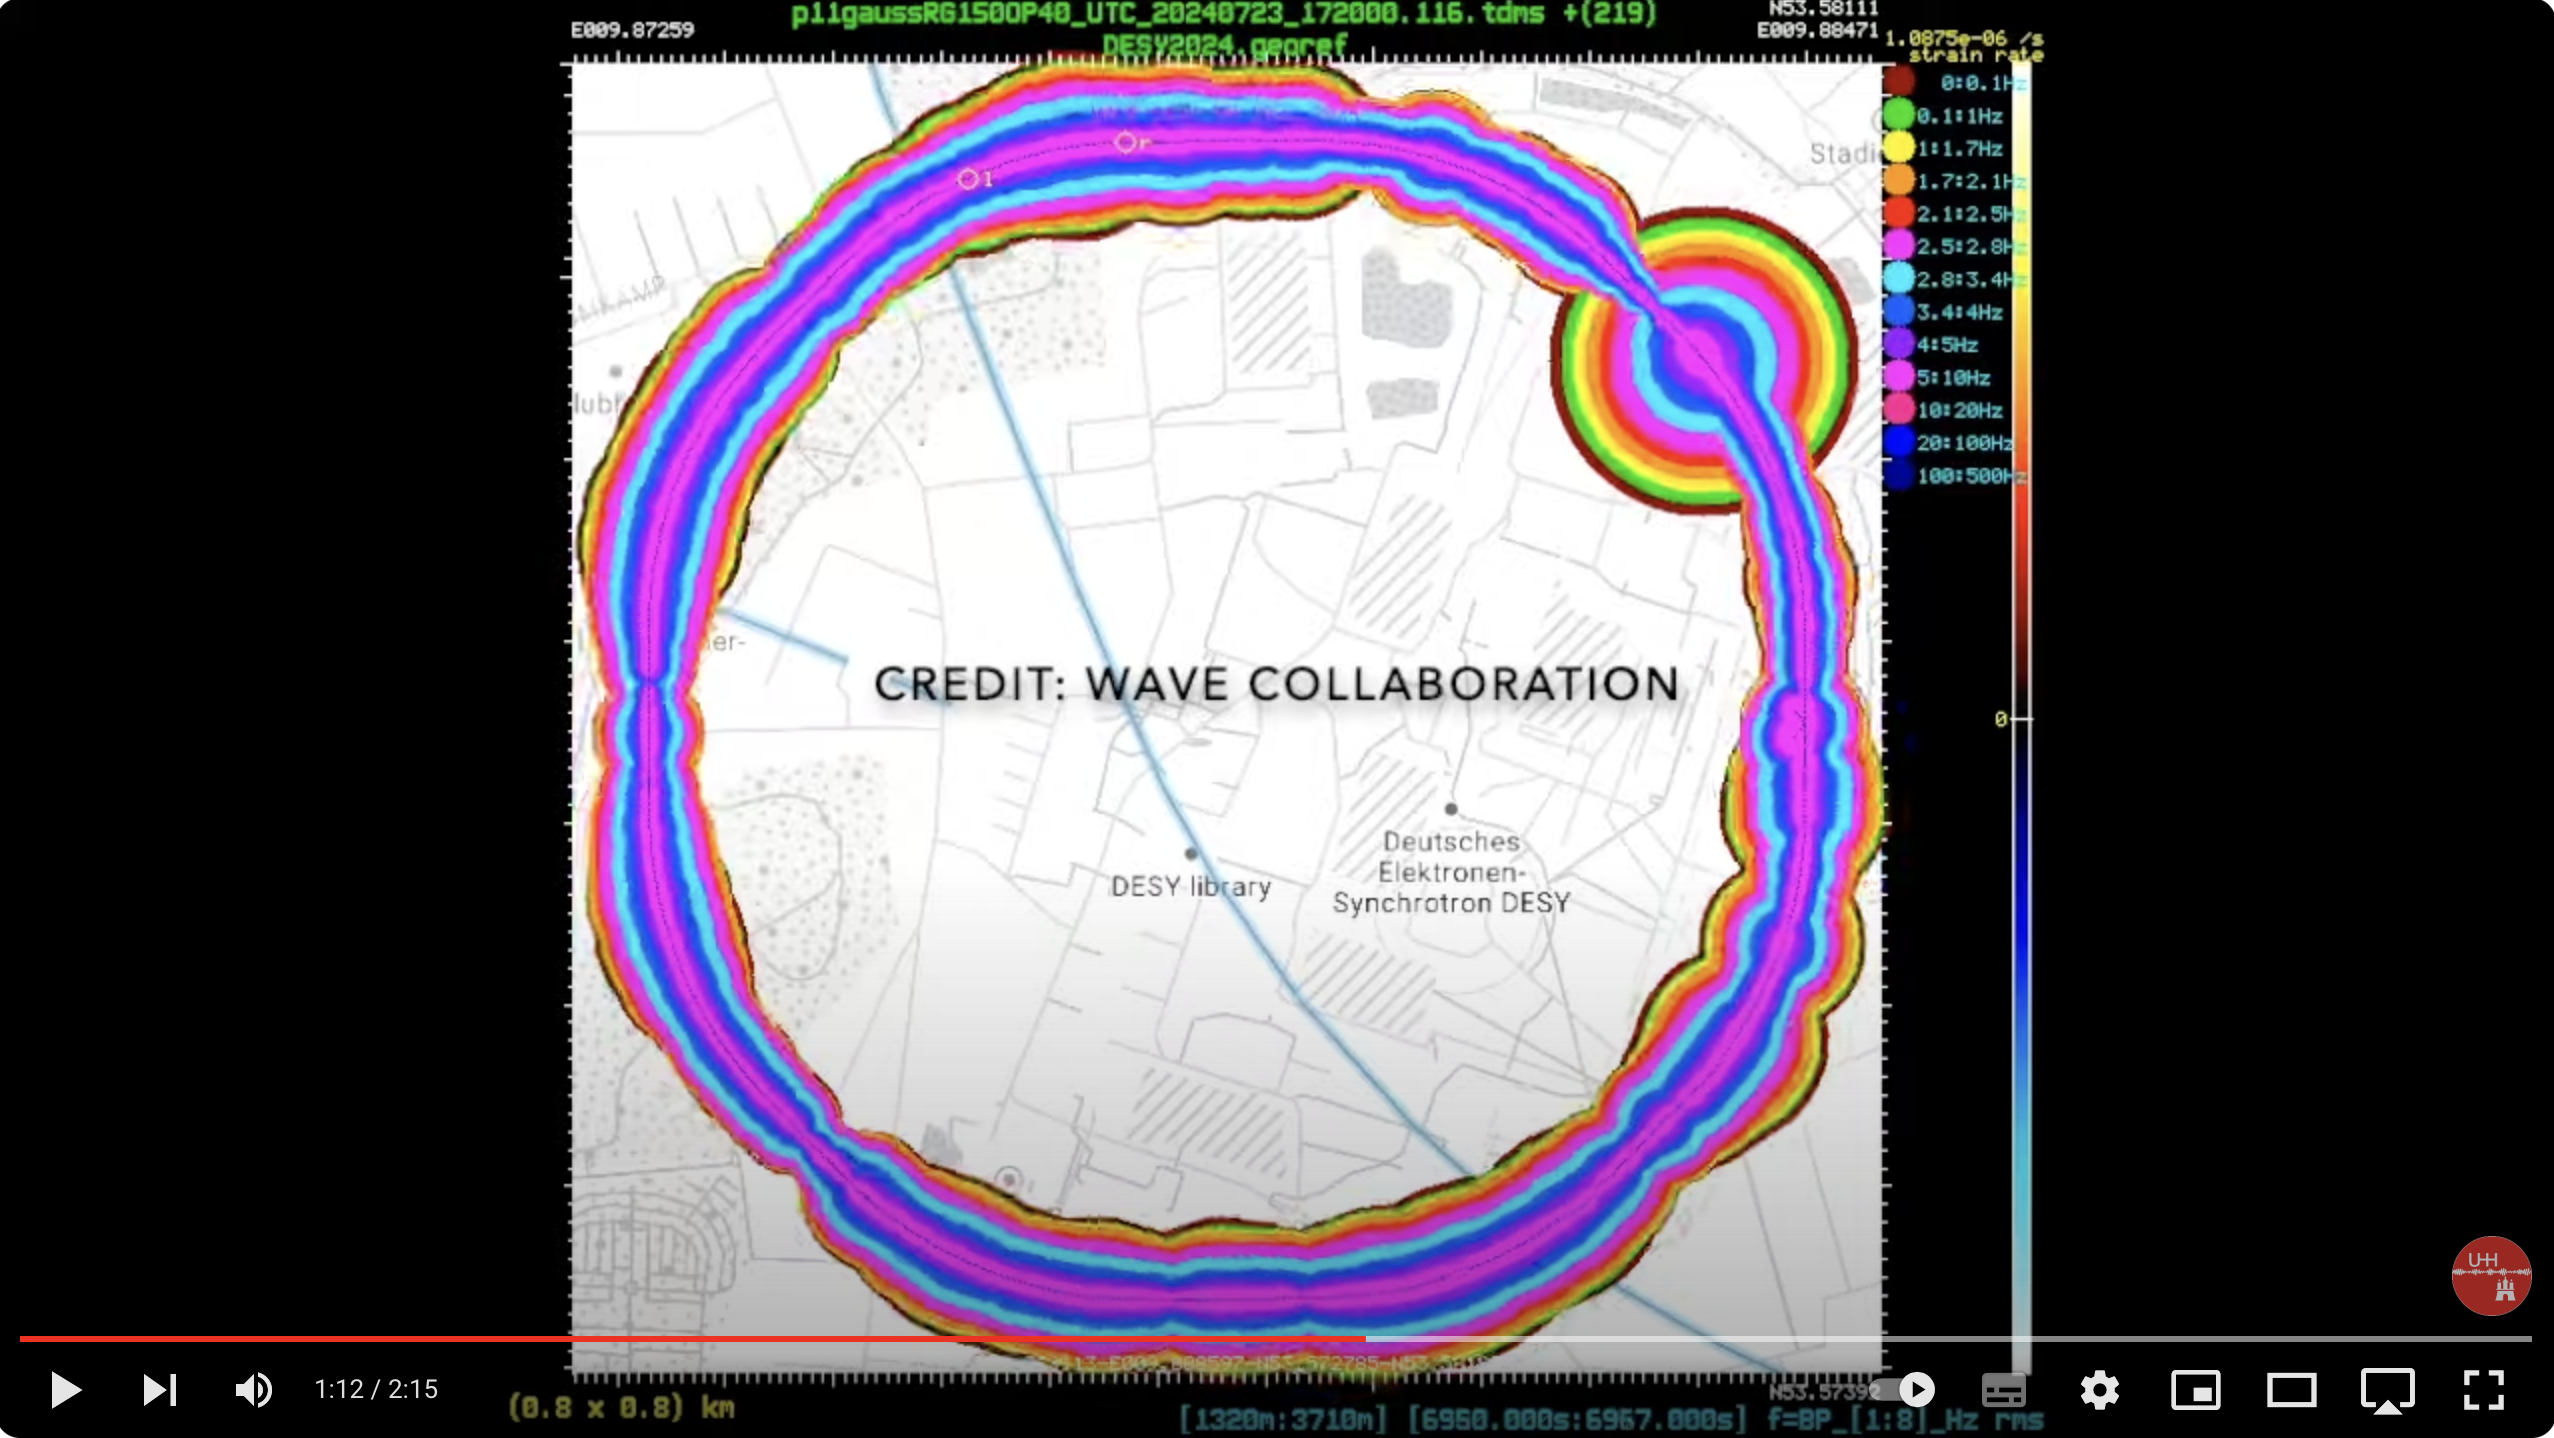
On the right in the Livestream we showed for the first time DAS data on a map along the PETRA ring. With this visualisation, we are able to show PETRA’s heartbeat during the Taylor Swift concert in Hamburg live! .
The ‘rainbow blobs’ show the strength of the arriving signals along the fiber but filtered for different frequency bands. So the wider a specific colour band is, the stronger are the waves vibrating in that range. They also help understand from what direction the signal is coming and help us observe along what path the waves are traveling. This is what we measured during the entire concert with a ring of optical fiber around the PETRA III accelerator ring of DESY, sped up 100 times.
Shake it Off - along the EuXFEL
We animated the seismic signals also along the full fiber track, including the EuXFEL which goes 3.4 km until Schenefeld. You see that the seismic waves from Love Story and Shake it Off reached all the way through the 3.4km long EuXFEL tunnel! These two songs were chosen for the animation as they produced one of the strongest signals in the DAS system.
For more results of the Taylor Swift concert and some explanations, check also our blog !
Deichkind
After tuning in to Taylor Swift and several soccer games, we seized the opportunity to listen to the Deichkind concert via our fiber glass network. On August 30th, Deichkind performed at Trabrennbahn, less than a kilometer from our Thousand Ear Experiment. During the concert, we once again offered a livestream, broadcasted on August 30th from 19:30 to 22:30 CEST.
Thanks to Wanda, who volunteered to attend the concert, we were able to create a complete playlist with precise timesteps for each song. Below, you’ll find the spectrogram for the entire concert, with clear signatures of each song.
 Spectrogram of the entire Deichkind concert, with clearly visible song signatures.
The songs can be generally categorized by their beats. Tracks like Wutboy, Hört ihr die Signale, and Remmidemmi have a consistent beat of about 2.2 beats per second, which fans responded to by jumping, causing specific frequencies to appear in the spectrogram. The more fans jumped, the higher the observed amplitudes.
On the other hand, slower songs like 99 Bierkanister and Keine Party displayed fewer jumps, while Kids in meinem Alter had the fastest beat, with approximately 3 beats per second.
Wutboy Spectrogram
Below is the spectrogram for the song Wutboy. The strong signals are visible with high amplitudes, which likely correspond to the repeated choruses where the audience was jumping to the rhythm.
 Spectrogram of the song *Wutboy, showing increasing and decreasing amplitudes reflecting the audience’s activity.*
Remmidemmi Correlation to YouTube Video
For Remmidemmi, we were even able to correlate the recorded spectrogram to a YouTube video of the performance. The larger amplitudes match up with the chorus and intense fan jumping, while smaller amplitudes coincide with calmer sections of the song.
Video of *Remmidemmi performance, showing how the spectrogram correlates to fan activity during the chorus.*
Seismic Waves: Hört ihr die Signale
The seismic waves caused by the song Hört ihr die Signale were particularly fascinating. Shortly after the song began, signal strength visibly increased, and we could track the waves originating from Trabrennbahn traveling westward through our fiber in the PETRA ring and into the European XFEL. So, do we hear the signals? Absolutely!
For detailed description of the results of the Deichkind concert, check also our blog !
Linkin Park
How are seismic waves related to sound and crowd movement? The following video gives an impression by combining seismic data, shown as a spectrogram, with a concert performance of Linkin Park’s Faint, capturing the vibrations of the audience applauding and jumping. The concert was given in the Barclays Arena in Hamburg on September 22.
Football
Public hearing EM24
Can We Hear the Goals from the Euros Underground? With our WAVE fiber-optic network, we listen to underground vibrations with a thousand ears. On July 5th, 2024, during the quarter-finals between France and Portugal at the Volksparkstadion Hamburg—just 2 km from our experiment—we livestreamed our vibration measurements throughout the match. When goals were scored, the celebrations created vibrations that we could detect! This was an exciting opportunity to test the sensitivity of our setup and see if we could capture these vibrations within the fiber network.

What happened when a goal was scored?
Before this football match, we already knew that we should able to pick up vibrations of concerts happening in the Volksparkstadion, since we have already picked up a concert by Metallica in the past. Lots and lots of fans jumping and dancing at the same time will cause the ground to vibrate a bit.
We expected that the fans in the stadion will celebrate and jump around when a goal is scored. Indeed, we were able to pick up the football fans getting excited and jumping around during the penalty shooting. We will upload some images here soon!
More information can be found on Reddit.
HSV
Details about the features and signals in the spectrograms are available in our posts linked directly to the images below:


WAVE Field and Science City Day
On Saturday, June 1, 2024, from 11:00 AM to 7:00 PM, the WAVE team participated in Science City Day at the DESY campus. Visitors explored the fascinating world of our fiber-optic seismic network, discovering where the fiber was buried and learning how it works. Attendees had the chance to generate their own seismic waves and find out what happens when you jump around on a bouncy castle. It was a day filled with hands-on fun and learning!
For more details about the event, click here or have a look to our blog post .