History of Waterfall diagrams in the Livestream on Twitch
Why did we start with livestreams? We do not remember exactly how it started, but I think Celine got a call from reporters for a local newspaper and they were asking whether we would see the famous Swiftquakes in July 2024 in our data. Celine had already given an interview to them, which is why they contacted us. Worldwide geophysicists were already measuring the so-called Swiftquakes.
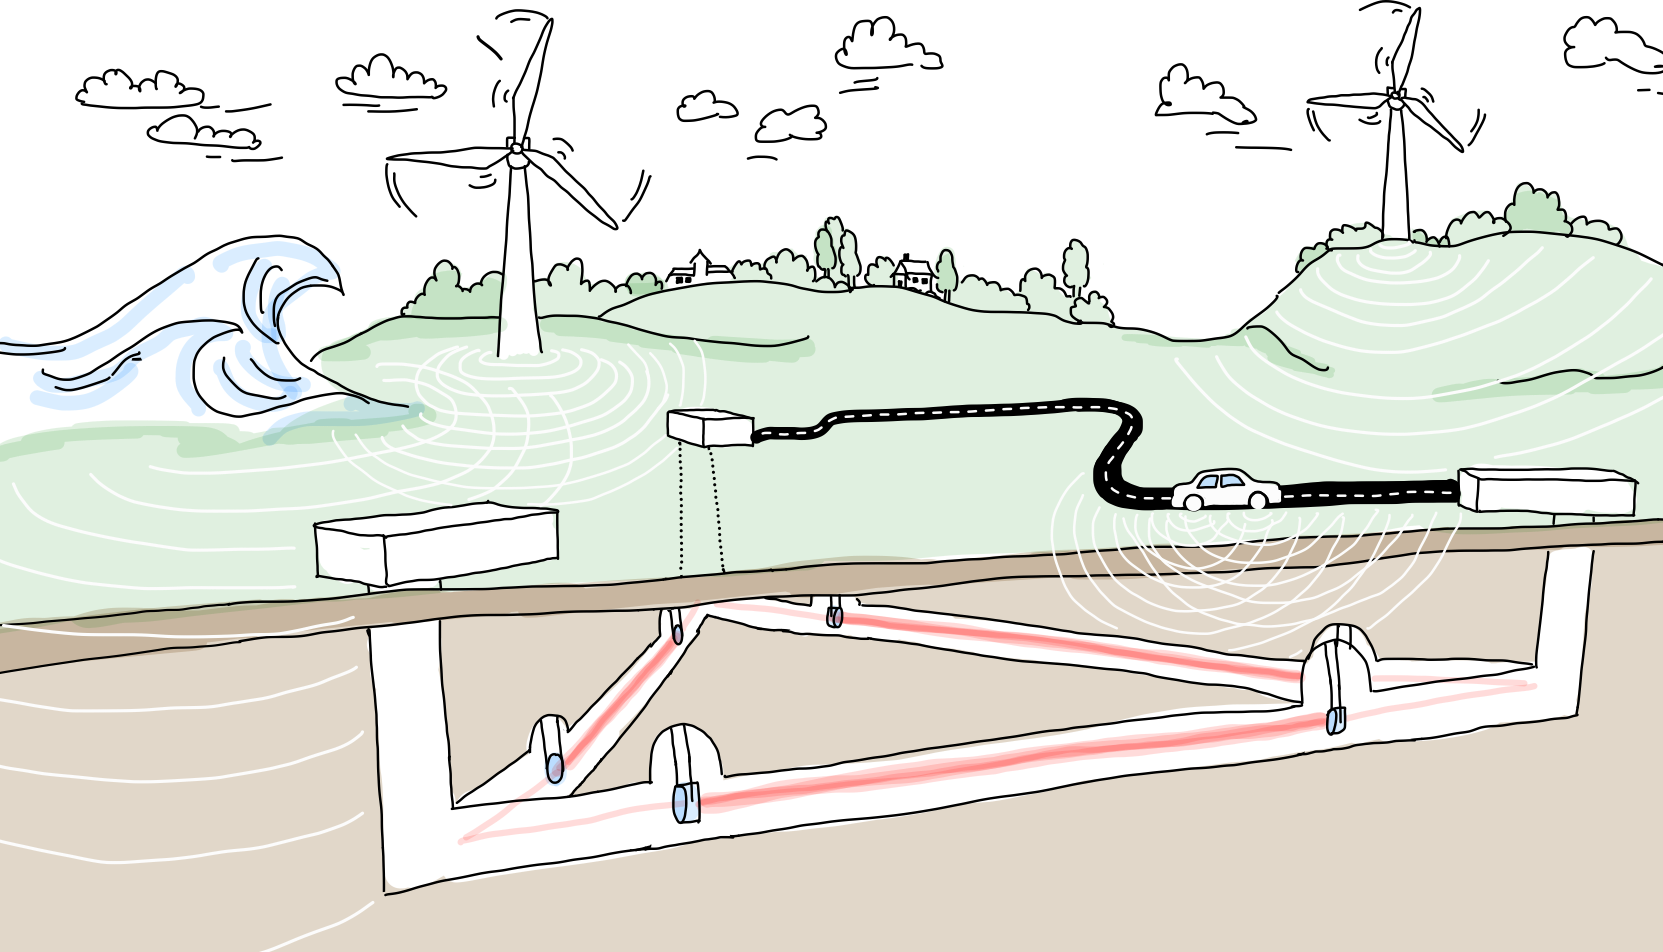
This is when we decided to set up a livestream. A livestream was also required for the Science City Day on the Bahrenfeld campus, where we wanted to set up a so-called WAVE field so visitors could explore the DAS technology. Here, we discovered that it is actually not easy to live stream data, as the software provided by the DAS interrogator’s company did not support this at the time. So we started sharing the screen of the software running on the DAS interrogator.
EM soccer match: DAS Software Streaming
Screen sharing of the DAS software was used for our first livestream. It was for the Euro Cup soccer game, the last one that took place in Hamburg’s Volksparkstadion.

The downside of this visualization was that we could not filter the data. Since we expect vibrations mainly in the low-frequency range of about 5 Hz, this representation was unfortunately not well-suited for clearly displaying the vibrations, but it was all we had at the time, as live data filtering is not simple to implement. Nevertheless, listeners found it fascinating, asked many questions on Twitch, and the Reddit post generated a lot of discussion.
Why 5 Hz signals? Because these are the seismic waves that travel long distances through the ground to the campus.
Taylor Swift: Our Realtime Viewer
Erik, our Ph.D. student who deals extensively with data analysis and computing on servers, managed to display the data from the DAS interrogator with relatively low latency (about 5 seconds) in a browser. He got a first version running for the Taylor Swift concert. On the first evening, July 23, the filter didn’t work. But the Swiftquakes, especially during “Shake It Off,” were easily visible in the viewer. Discussions on Twitch were intense, and Katharina and Oliver were busy answering all the questions, even though both were slightly feverish with COVID-19 and working from home.
On the second evening, Erik got the live filtering working, and the signals were even clearer to see.

In this livestream, on the right side, you also see a bubble plot with a map of the Bahrenfeld campus. We determined the positions of most of the fibers (the seismic sensors) through georeferencing, meaning that the individual channels visible in the waterfall diagram can be assigned GPS positions. The fiber laid through the PETRA Ring was displayed in this plot on the right, showing the signals. We divided the signals into different frequency windows and represented them as bubbles of different colors. The larger a bubble, the stronger the signal in that frequency band. For the Taylor Swift concert, this meant that the red bubbles were consistently active and lit up the entire PETRA Ring, especially during “Shake It Off.”
HSV Soccer match August 2024: Next Generation Realtime Viewer
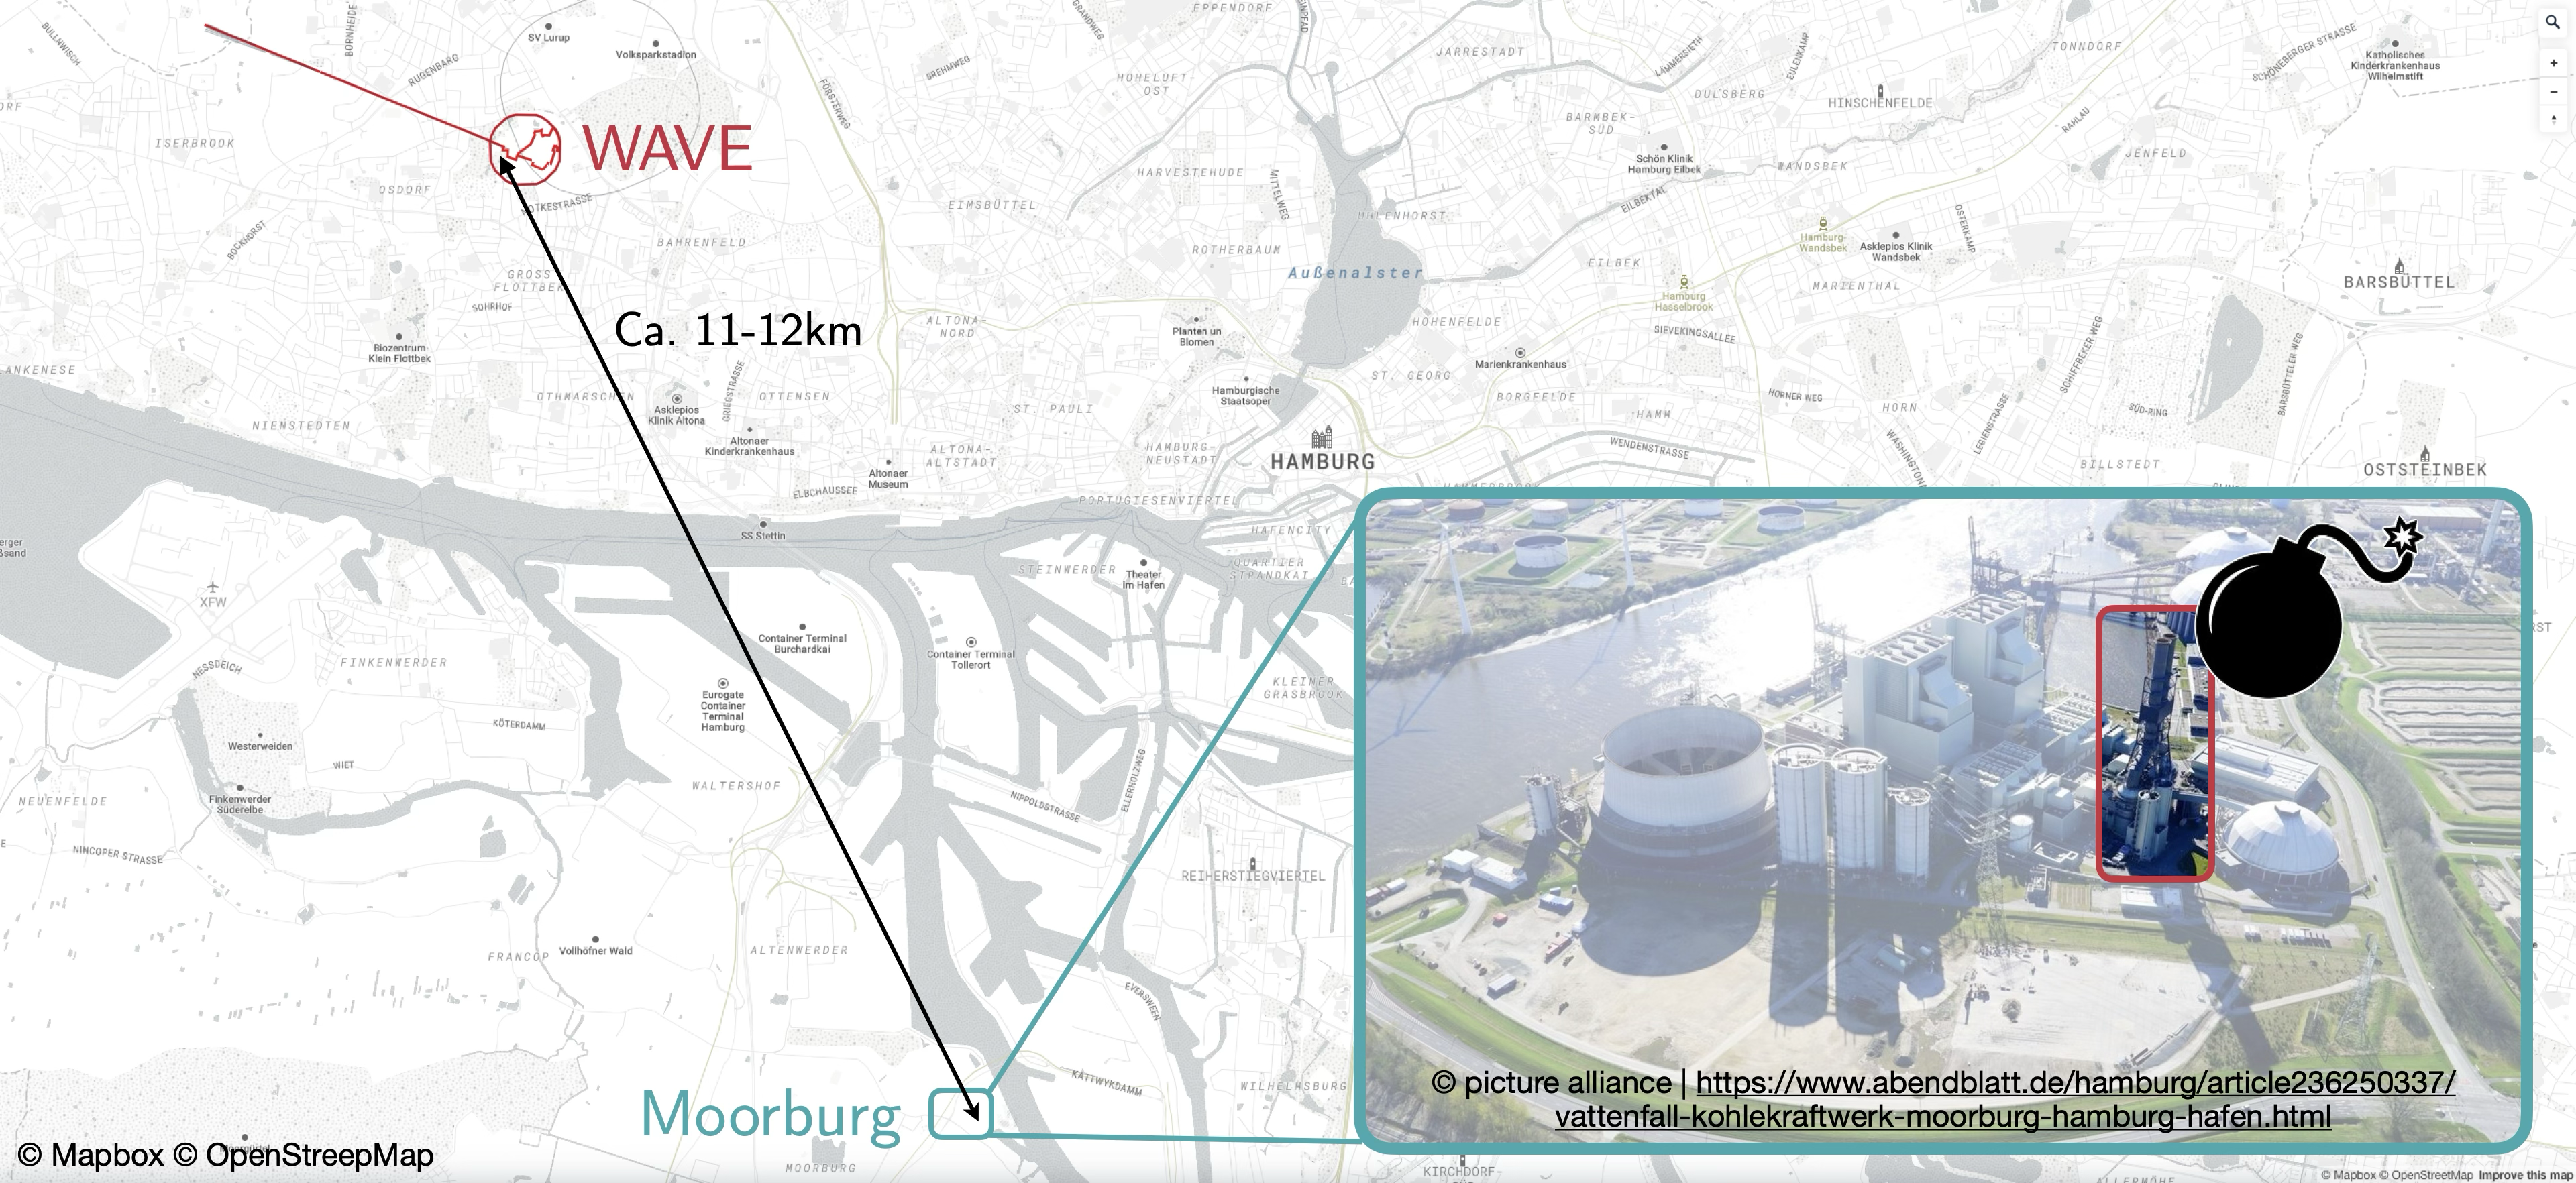
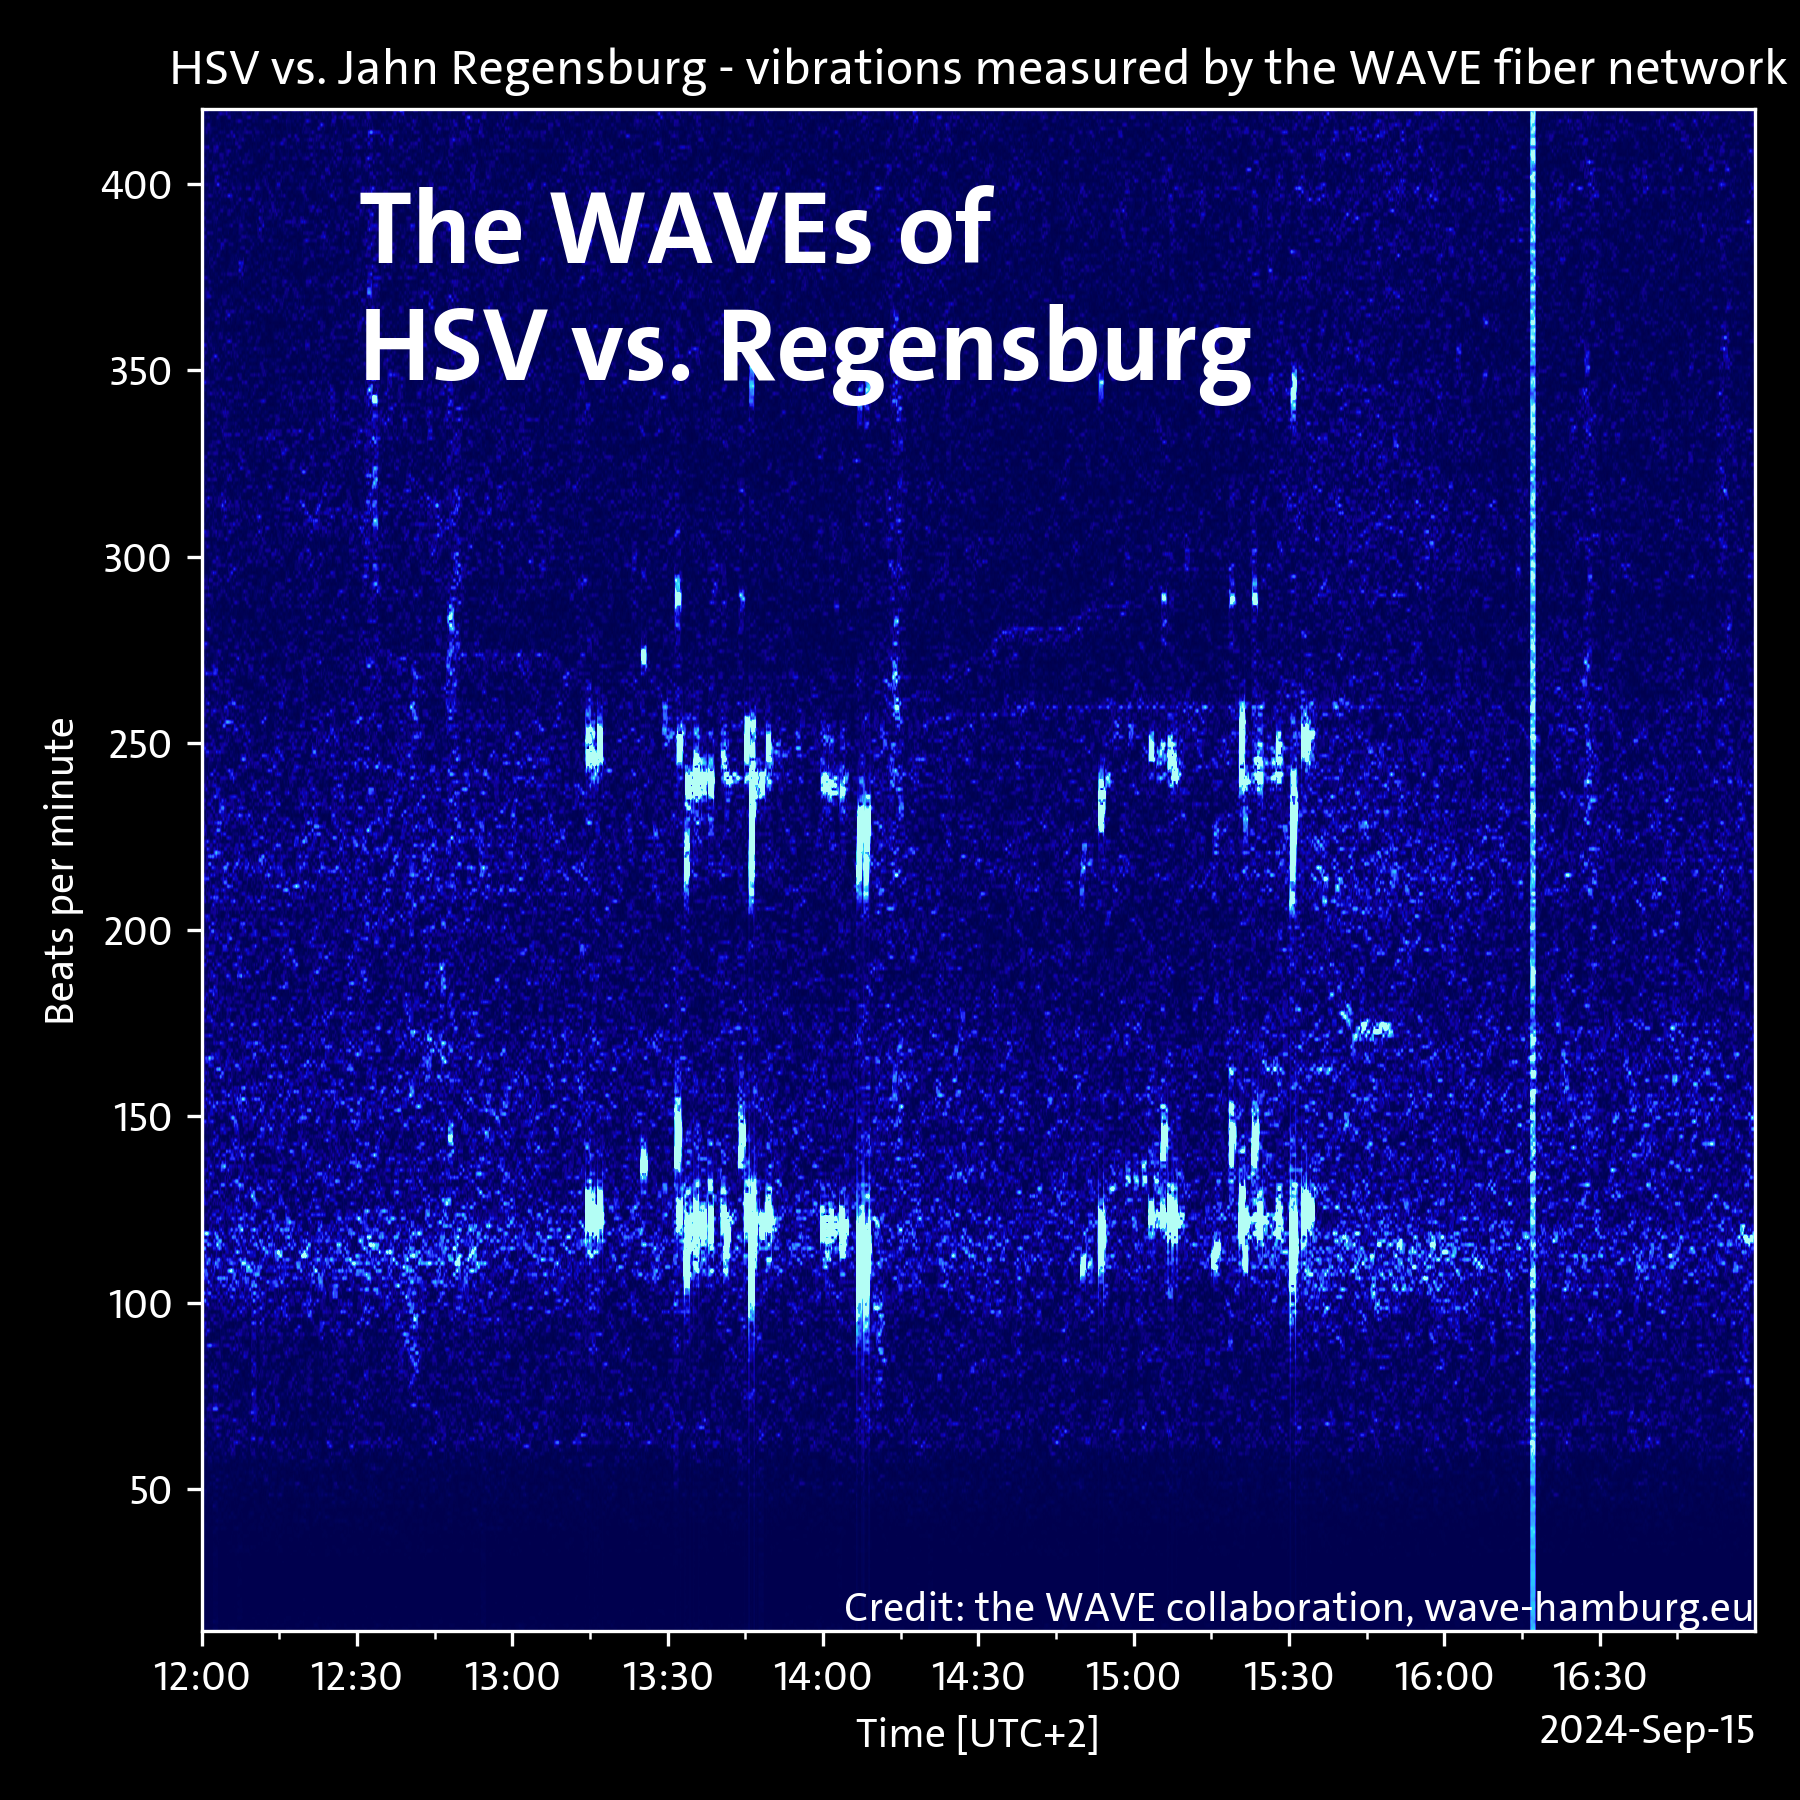
Erik stepped up and designed a real-time viewer with improved display and filtering. Even during the soccer match, where we hadn’t seen anything in previous viewers, the vibrations were so visible that we will be busy for the next few weeks figuring out whether these signals truly all came from the Volksparkstadion, 2 km away.

Alexander watched the soccer game live and could at least associate some of the signals with goals or drums. It seems real! The Deichkind concert is next, on August 30, this time right next door at the Trabrennbahn. We are excited.


