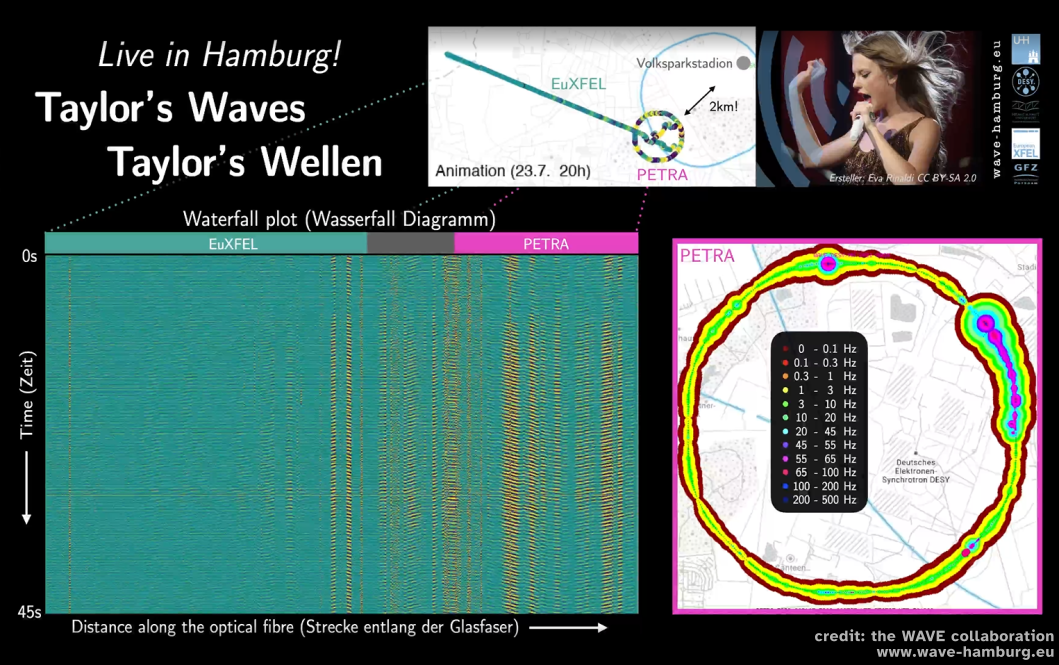
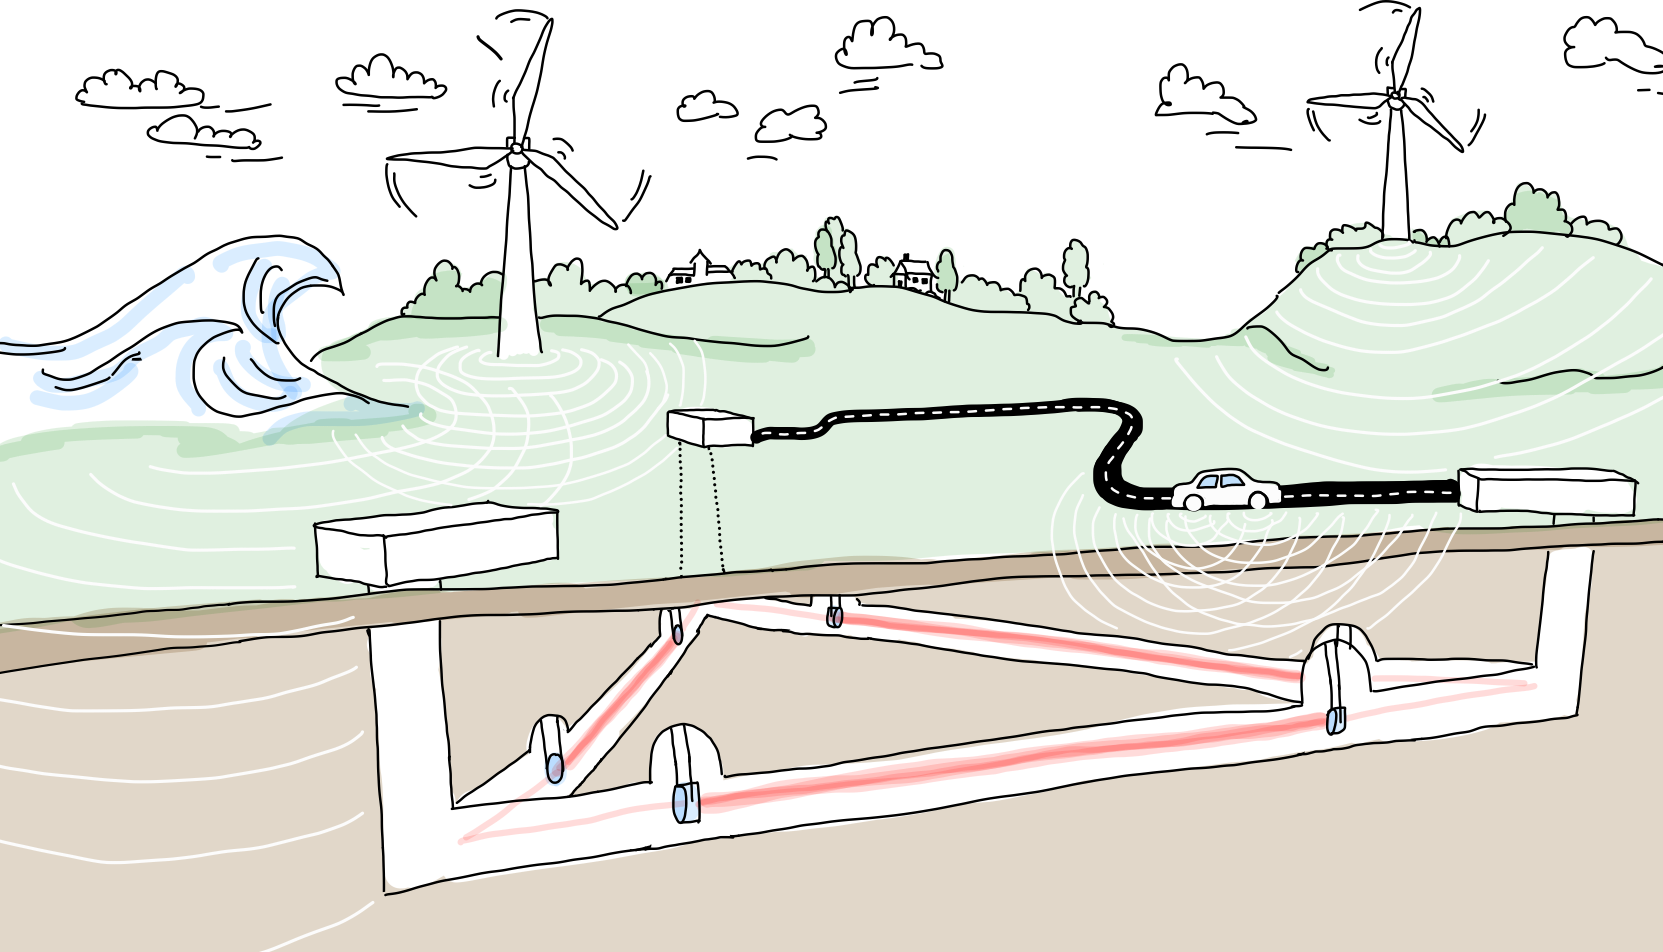
A key element of WAVE is the use of modern seismic sensors, in particular distributed acoustic sensing (DAS). This technology uses fiber optic cables as sensitive seismic sensors. It enables ground motion data to be recorded at an unprecedented spatial density over long distances.
News
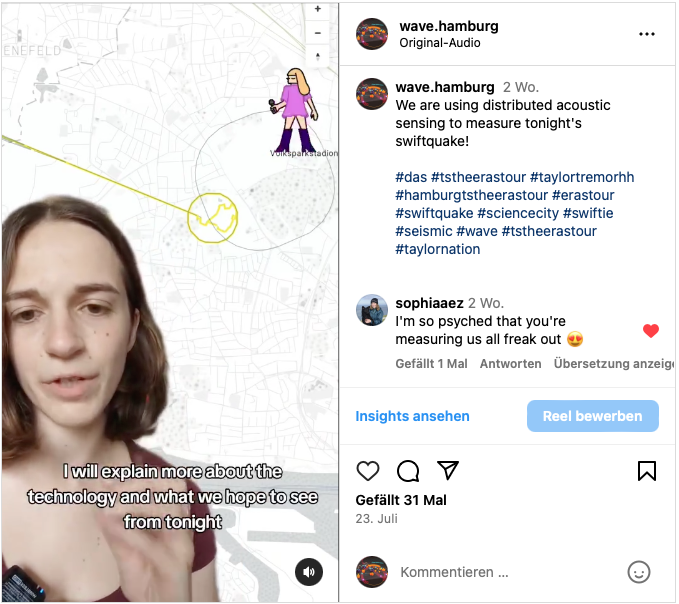
Livestream
 Experience real-time campus vibrations live on Twitch! If you cannot see the embedded video go to our Twitch Channel, scan the QR code or check out our list of planned livestreams.


Wave field
In June 2024, we debuted a prototype of our WAVE Field—a playground designed for visitors of Science City Day to explore the WAVE seismic network.

Science
The WAVE team is interdisciplinary and involved science projects from geophysics, seismology, physics - especially accelerator and gravitational wave physics, informatics and engineering.

The WAVE Team
We are a young collaboration of seismologists, physicists, engineers and computer scientists. Meet our team from the University of Hamburg, DESY, Helmut Schmidt University, GFZ Potsdam, and XFEL, working together on seismic and geophysical research.